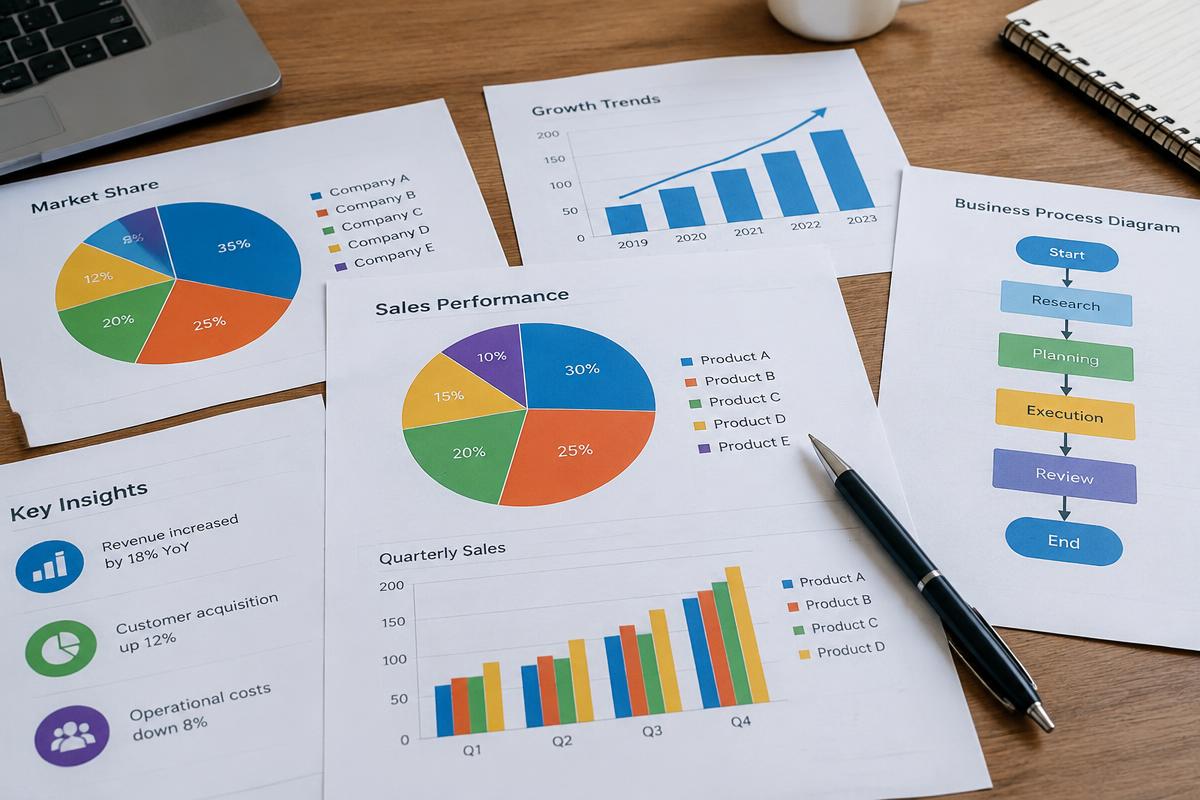
Three basic forms
Adding graphics — pie charts, line graphs, photographs, drawings — greatly increases a project's accessibility and can condense large amounts of information into a format that is easy to understand. There are three basic forms: charts, graphs, and illustrations. Each has specific uses depending on what you wish to communicate. Vary formats, give each graphic a caption at the bottom and a reference number at the top, and place graphics as close to their textual reference as possible.
Charts
Charts communicate relationships among items without being plotted on a coordinate system. Examples include pie charts, flowcharts, organizational charts, pictorial charts, column charts, and tree charts. As with all numerical charts and graphs, make sure the parts add up to 100% of the total.
- Pie charts place the first radial arm at twelve o'clock and move from the largest to the smallest wedge around the chart.
- Limit a pie chart to eight or fewer wedges, lump small amounts into a wedge labeled "other" or "misc." and move it to the final section, and place labels horizontally around the chart. Keep labels short.
- Flowcharts trace a process from beginning to end — for instance, the steps involved in producing a play, from script selection through opening night.
- Organizational charts rank personnel within a group and are useful for showing potential donors and government agencies who is in charge.
| Category | Percentage |
|---|---|
| rent | 40% |
| utils. | 25% |
| prod. | 20% |
| misc. | 15% |
Graphs
There are two basic types of graphs: the bar graph and the line graph. Along with the pie chart, graphs make up the most popular group of visuals in business and technical writing. Bar graphs are easy to construct and simple to understand while conveying large amounts of information; a simple bar graph presents a single relationship.
| Year | Accidents |
|---|---|
| 1992 | 2,000 |
| 1993 | 1,500 |
| 1994 | 2,500 |
- Multiple-bar graphs compare two or three relationships and include a legend to decipher the bars.
- Horizontal-bar graphs turn the bars from the vertical to the horizontal axis, which is excellent for several bars arranged in increasing or decreasing order.
- Stacked-bar graphs work on the principle that each item contributes to a whole, so each bar compares two or three relationships.
- 100-percent bar graphs, a form of the stacked-bar graph, compare items that constitute a 100% value, on either axis.
- Deviation bar graphs display both positive and negative values — for example, a checking account balance including overdrawn amounts.
| Category | Value |
|---|---|
| stock A | 200 |
| stock B | -150 |
| stock C | 100 |
A line graph represents comparisons using horizontal lines rather than blocks, and unlike other visuals it can show incremental trends over a period of time.
- Use no more than three or four comparison lines per graph and label each line.
- Use different colors or graphical symbols to distinguish lines.
- Indicate data points along each line for easy reading.
- Develop a consistent increment system for data points. Do not distort information.
Illustrations
Illustrations are diagrams, photographs, drawings, or other non-text materials that clarify and enhance the document. Unlike charts and graphs, which highlight numerical relationships, illustrations provide a visual cue based on a physical relationship — for instance, a floor diagram showing emergency exits, with the warning not to use elevators. A cutaway diagram shows how something is assembled and is often used to illustrate a structure or a procedure.
- Crop images to include only the relevant material. Photos of people should be cropped to a full headshot or a close crop of a few people.
- Keep backgrounds simple and crop out clutter.
- Use photographs for an overall view of a subject; use diagrams to indicate precise points.
- Art adds elegance to your project but may not show precise details.
General guidelines for visuals
- Do not overuse visuals. They should represent no more than 10–25% of the total project unless there is a specific reason.
- Limit the amount of information in each visual, especially in charts presenting numerical data. Two separate visuals beat one cluttered visual.
- Add appropriate labels for each visual so readers can follow your reasoning.
- Add captions and use a consistent numbering and caption system for all visuals.
- Use visuals appropriate to your project and your audience. Learn the uses of the various types.
- Place visuals near their point of reference — no more than a few paragraphs away, and ideally on the same page as the referent text.
- Do not distort graphics to misrepresent information, over-emphasize good news, or hide bad news.
Guide: Technical & Business Writing
NEXT · PART SEVEN: Word Choice, Persuasion and Speaking
Continue the guide